
Atlanta 2022: Year in Review
2022 Atlanta Housing Market Analysis

Atlanta Housing Market Analysis
Despite major fluctuations in the national economy during 2022, Atlanta remained relatively insulated from the economic impacts felt in some other major Metros. The Atlanta MSA netted 128K new jobs over the last 12 months, and the unemployment rate fell from 3.3% in January to 2.6% by the end of the year. Several major expansions and relocations were announced in Atlanta during 2022 from corporations including Wal-Mart, Carvana, Google, and Twitter, and the timing of these announcements (amidst growing fears of a global recession) reinforce the region’s economic diversity and resilience. That being said, Atlanta’s employment could be impacted over the coming months by an increasing number of layoffs from the tech industry, which accounts for about 18% of Atlanta’s workforce. While most expect Atlanta to remain relatively immune to mass waves of tech layoffs, it is certainly possible that workforce reductions by major corporations like Twitter, Google, Microsoft, Meta, and Amazon could potentially impact their Atlanta operations.
Activity across Atlanta’s housing market during 2022 largely reflected the slowdown seen across the nation over the last 12 months as high home prices, construction costs, and mortgage rates further eroded affordability and disqualified a large percentage of potential homebuyers. The Federal Reserve Bank of Atlanta officially deemed the Atlanta housing market as unaffordable in early 2022, and prices continued to climb throughout the year (albeit more modestly) as the decline in inventory continued to outpace the decline in demand. The median home price in December 2022 was $389K, +3% higher than the start of the year. With a median household income of just over $69K, the typical Atlanta household can afford a monthly mortgage payment of just $1,610 (28% of gross monthly income). Assuming a 6.5% interest rate, the maximum loan a typical houshold could qualify for is approximately $260K - well below the median home price.
Both new and existing home sales activity in Atlanta remained constrained throughout 2022 due to a combination of high prices, rising mortgage rates, and low inventory. Homebuilder activity slowed significantly in response to waning demand as the year progressed, and starts and new home closings declined considerably from the post-pandemic highs (although new home closings and lot deliveries remain well above pre-pandemic levels). Existing inventory remains undersupplied as current owners have very little incentive to list their current homes and relocate; they would likely pay an inflated price for their new home due to lack of inventory while also taking on a higher mortgage rate than what they have on their current homes.
A summary of key market indicators is provided below:
Sources: BEA, BLS, Census Bureau, Atlanta Association of REALTORS, Bisnow, Atlanta Business Chronicle, Zonda/Metrostudy
Mortgage Rates

Source: Mortgage Bankers Association

Source: Mortgage Bankers Association
In an effort to further combat sticky inflation, the Federal Reserve Bank increased the Federal Funds Rate an additional +150 basis points during Q4. The +425-basis point increase over the course of 2022 (x7 individual rate hikes) was the largest annual increase since the 1980’s and had a significant impact on mortgage rates. After peaking at 7.08% in early November, 30-year mortgage rates responded to softening inflation and declined to 6.42% by the end of December. Mortgage rates are expected to decline further, albeit modestly, over the coming months assuming inflationary measures continue their downward trend; many economists project rates to stabilize between 5-6% during 2023.
Active Listings

Source: Atlanta Association of Realtors

Source: Atlanta Association of Realtors
Note: The Active Listings analysis only includes the 11 core counties in Metro Atlanta. The remainder of the report analyzes all 23 counties comprising the Atlanta MSA.
Metro Atlanta’s supply of active listings was unchanged during Q4 and ended the year at 2.1 months of supply. Supply levels remain well below “normal” (6-8 months) for this market, and both new and existing available home inventories remain approximately -30% below pre-pandemic levels. We expect the supply of available homes to remain constrained for the foreseeable future; existing homeowners have little incentive to sell given high home prices and the current interest rate environment, and most homebuilders are strictly limited to new spec construction given surpressed demand.
Housing Starts

Source: Metrostudy
Total annualized housing starts declined by -15% during Q4 and by -25% since the start of the year (lowest level since 1Q17). Detached starts fell by -15% during Q4 and are down -26% over the last 12 months, ending the year -12% below pre-pandemic levels (2019). Attached starts fell by -16% and -23% during Q4 and 2022, respectively, but remain +9% above pre-pandemic levels. We have already begun to see evidence that homebuilder sentiment in the Atlanta market is rebounding; while we expect both attached and detached starts to improve modestly during 2023 from current levels, we don’t believe that total starts will return to pre-pandemic levels before the end of 2023.

Source: Metrostudy
Increased land, materials, and labor costs contributed to an increased number of housing starts in the upper price tiers in 2022. The $300K range continues to represent the largest share of starts in this market, but not by much - the share of homes in this range is less than 1% greater than homes in the $400K range. Over the last 12 months, the share of new homes started below the $400K price point fell by -49%, further evidence of Atlanta’s compounding affordability challenges. Declining materials and labor costs might provide some mild price relief during 2023, but the limited supply of viable lots will continue to push housing starts towards the upper price tiers.
New Home Closings

Source: Metrostudy
Total annualized new home closings declined on both a quarterly and yearly basis during Q4, falling by -5% and -13%, respectively. Detached closings fell by -6% from Q3 and by -14% over the last 12 months; attached closings fared slightly better, declining by -5% and -9% over the same periods. While total closings are down on an annual basis, it’s important to note that they remain nearly +6% above pre-pandemic (2019) levels, an indicator of resilient demand and relative affordability. With inflation, mortgage rates, and home price acceleration trending downward, we expect new home closings to remain above pre-pandemic levels in 2023.
Lot Deliveries

Source: Metrostudy
Atlanta’s housing market was deemed “unaffordable” in 2022, and the pricing evidence certainly supports this designation. The number of new homes sold below the $400K price point declined by -44% over the last 12 months, whereas the number of new homes sold for more than $400K increased by +56% over the same period. With a median household income of just over $69K, the typical Atlanta household can afford a monthly mortgage payment of just $1,610 (28% of gross monthly income). Assuming a 6.5% interest rate, the maximum loan a typical household could qualify for is approximately $260K - well below Atlanta’s median home price of $389K.

Source: Metrostudy

Source: Metrostudy
Lot deliveries remained relatively unchanged from 12 months ago, increasing by +2% from Q3 and decreasing by -1% on an annual basis. Lot production remains elevated despite waning homebuilder and homebuyer demand as the majority of the lots currently in development were started before the impacts of rising inflation and interest rates fully set in. The majority of lots in Atlanta’s development pipeline are considered dormant (no activity in 2+ years), however there were more than 39K lots in active development at the end of 2022. Based on current progress, we believe that upwards of 60% of these lots will be delivered in the next 12 months.
Lot Inventory & Supply

Source: Metrostudy
Single-family detached VDL inventory continued to trend downward in 2022, falling by -5% over the last 12 months to approximately 37K finished SFD lots. Note that Atlanta is known for its comparatively high percentage of “zombie lots” - relics from before the Great Recession that will likely never see new home construction - and the actual inventory of viable SFD VDLs could be as low as 28K. Because the decline of SFD housing starts outpaced the decline of SFD VDL inventory, however the supply actually improved during the year to 26.7 months.

Source: Metrostudy
Single-family attached VDL inventory improved on both a quarterly (+2%) and annual (+6%) basis during 2022 due to a combination of increasing SFA lot development and declining housing starts. SFA housing product has become increasingly popular amongst both builders and buyers over the last 12 months; attached product is attractive to buyers as it is generally offered at a lower price point than its detached counterpart, and attached product is attractive to builders because it allows them to maximize site density and reduce per unit costs.
Market Leaders

Source: Metrostudy
Gwinnett led the Atlanta MSA in total housing starts, beginning more than 3,100 new homes over the last 12 months. Historically strong performers like Cobb and Fulton remain in the top 10 but are quickly being surpassed by emerging stars like Cherokee, Jackson, and Forsyth. Starts activity will continue to be heavily influenced by the availability and price of land, so we expect suburban and exurban development to become even more pervasive during 2023.

Source: Metrostudy
Of the 23 counties analyzed for this report, only 3 counties started more homes in 2022 than they did in 2021: Dawson, Fayette, and Jackson. The other 20 counties comprising the Atlanta MSA experienced annual declines ranging from -2% (S Fulton) to -56% (Clayton); even juggernauts like Gwinnett, Cobb, and N Fulton experienced significant, double-digit declines in housing starts over the last 12 months. For context, only 6 counties experience declines in starts activity when we ran this analysis 12 months ago.

Source: Metrostudy
As with starts, Gwinnett maintained its dominance in new home sales during 2022, closing nearly 3,500 new homes over the 12-month period. Also similar to starts, many of the top performing counties are located in Atlanta’s distance suburbs and exurbs (30+ miles from the urban core) where land, and therefore homes, are more plentiful and affordable. Given our expectation that home prices will not experience a significant backslide in 2023, we anticipate that suburban and exurban counties offering comparatively lower-cost homes will comprise an increasing share of new home closings in 2023.

Source: Metrostudy

Source: Metrostudy
17 of the 23 counties analyzed for this report experienced annual declines in new home closings, an unsurprising fact given the rapid run-up in both home prices and mortgage rates over the last 12 months. Fayette, Dawson, Barrow, and Henry counties, however, all experienced double-digit increases in new home closings during 2022 - further evidence that price is driving home sales more than location, at least for now. Despite the widespread decline in closings during 2022, it’s important to note that 14 of the 23 counties analyzed above still reported annual sales figures above their pre-pandemic levels.

Lot development is being heavily influenced by the availability and price of land, leading to an increase in development activity farther from the urban core. This trend is evidenced by the lot delivery leaders detailed above, which skew heavily towards the secondary submarkets on the fringes of the Metro area like Jackson, Cherokee, and Forsyth. As historically dominant counties like Gwinnett and Cobb build through their dwindling supply of residential land, we expect that development activity will continue to trend towards Atlanta’s outer suburbs and exurbs.
12 of Metro Atlanta’s 23 counties increased lot deliveries during 2022 led by increases in Newton, Douglas, Rockdale, Walton, and Jackson counties (although Newton’s incredible rebound should be attributed to its previous lack of activity due to a residential development moratorium as opposed to a massive uptick in deliveries). The most notable declines during 2022 include Clayton, Fayette, Hall, and Carroll counties. The declines in Fayette, Clayton, and Carroll are somewhat less staggering than the percentages indicate with declines ranging between 250-650 lots; Hall County’s decline, however, is significant as it delivered 1,330 fewer lots in 2022 than it did in 2021.
Top-Performing Communities

Source: Metrostudy/Zonda and DeKalb, Fulton, Barrow, Cherokee, Jackson, Henry, and Gwinnett County Tax Assessors.
Note: When sales transaction data was not publicly available, current listing data was used to calculate average price.
* Combined across all sub-communities and homebuilders.

Source: Metrostudy/Zonda and Fulton, Jackson, Barrow, Dawson, Forsyth, Fayette, and Spalding County Tax Assessors.
Note: When sales transaction data was not publicly available, current listing data was used to calculate average price.
* Combined across all sub-communities and homebuilders.

As detailed in previous sections, new home closings took a considerable hit across the Metro area in 2022, declining by -13% over the last 12 months. Even Atlanta’s top performing communities were not immune to the challenges faced by both homebuilders and homebuyers as evidenced by decreased sales volumes during 2022 as compared to the prior year. For context, the top selling community of 2021, Twin Lakes, accounted for 346 new home closings over that 12-month period; Twin Lakes was also the top-selling community of 2022, but closed just 288 new homes over the last 12 months (-17% fewer homes).
Below are some key observations of the top performing communities of Q4 and 2022 overall:
New home construction continues to push farther from the urban core. 6 of 2022’s most active communities (blue) are located more than 30 miles from the Midtown/Downtown corridor.
Interestingly, construction activity began to creep back towards the city as the year progressed. When
Looking just at Q4 activity, only 4 of the top-performing communities were located more than 30 miles from the urban core. It’s worth nothing that 3 of the 6 communities in closer proximity to the city center are infill townhome projects.
8 of 2022’s top performing communities have less than a year’s supply of finished lots, indicating that they will likely build through their existing lot inventories over the next 12 months. Further, the majority of these communities do not have any future lots in the development pipeline.
Attached product continues to be an attractive option for builders and buyers alike. 4 of 2022’s top performing communities feature townhome product, which offers buyers a lower-cost alternative to traditional SFD product while still allowing them to fulfill their dreams of homeownership.
Source: Metrostudy
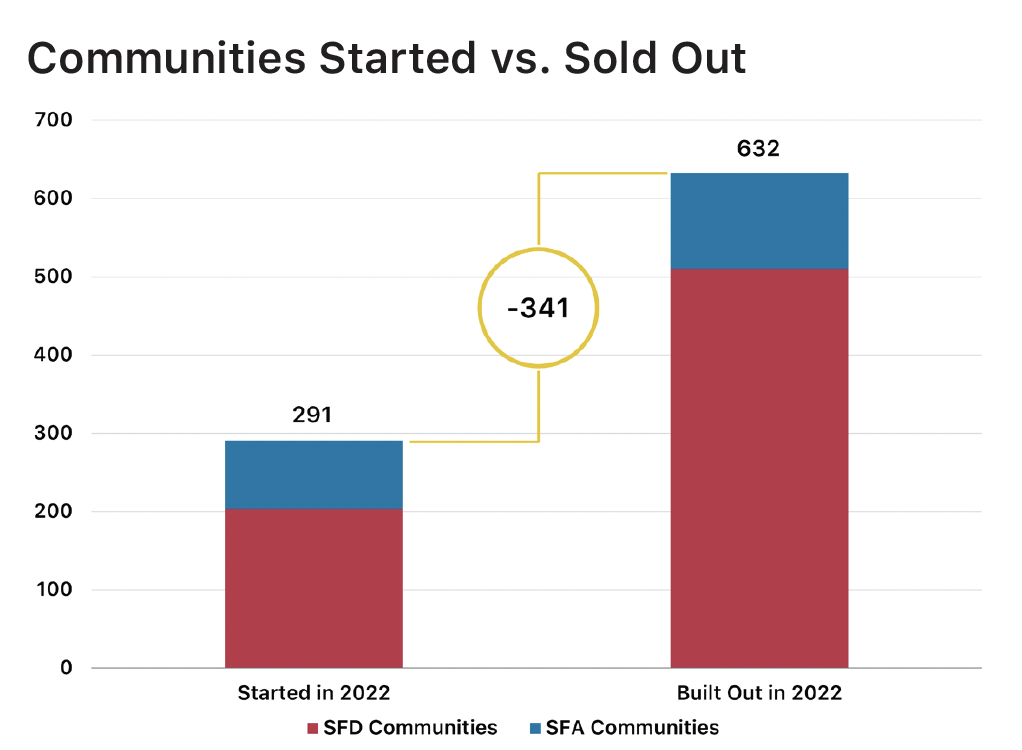
Atlanta’s critical imbalance between supply and demand becomes more evident when examining new communities across the Metro Area. 291 new home communities were started across the region in 2022, but 632 new home
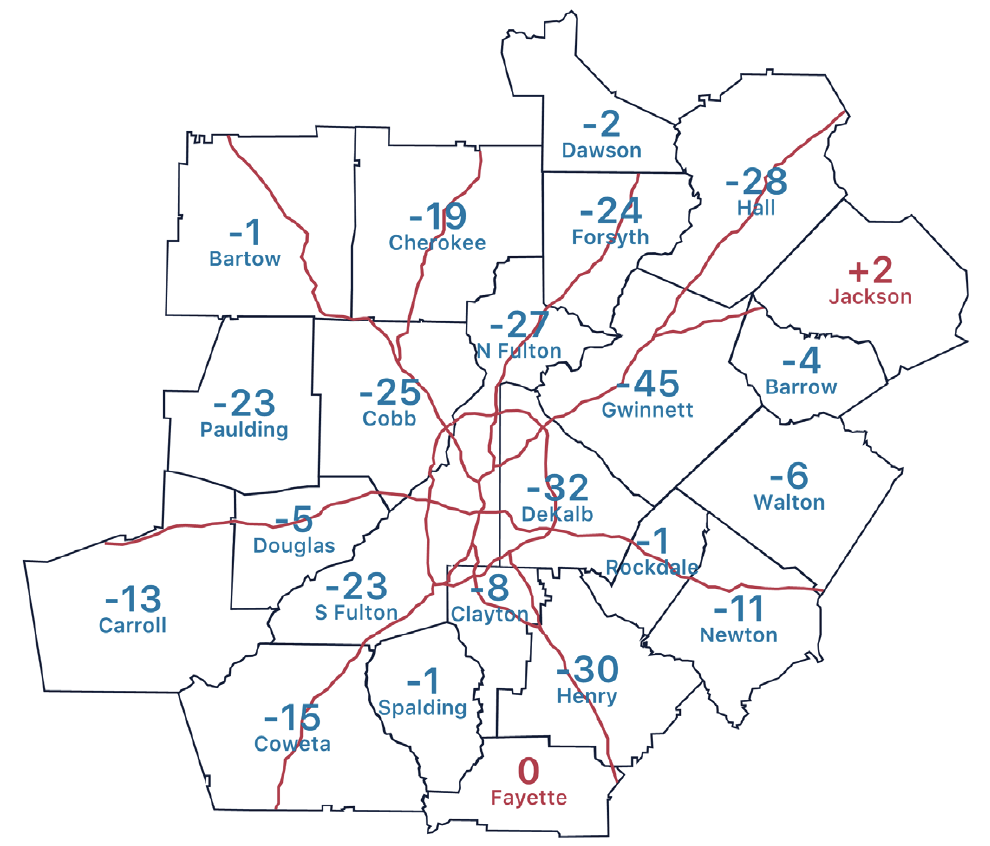
communities sold out over that same period. The map above illustrates each county’s net change in active community count during 2022. Unsurprisingly, core suburban counties like Cobb, Gwinnett, N Fulton, and DeKalb experienced significant gaps between communities started and sold out. More surprisingly, we are seeing a major shift in counties like Forsyth, Hall, Henry, and S Fulton - submarkets that burned bright as the pandemic recovery got underway - as communities that rose in response to the initial wave of pandemic-related demand sell through their final inventory.

Source: Metrostudy/Zonda

Source: Metrostudy/Zonda
Despite a -14% decline in annual production, D.R. Horton led the Atlanta MSA in new home closings during 2022, accounting for just over 2,900 closings over the last 12 months. D.R. Horton was not the only builder to slow production and sales in 2022, however; 6 of the most active builders closed fewer new homes in 2022 than the previous 12-month period. The most notable declines include a -34% drop in sales by Century Communities and a -19% decline by Chafin Communities/Clayton Properties Group.
The reverse of this coin is that 4 of Atlanta’s most active homebuilders managed to increase their new home closings over the last 12 months despite ongoing materials, pricing, inventory, and demand challenges. The most notable increases in new home closings during 2022 came from Starlight Homes/Ashton Woods (+90%) and Dan Ryan Builders/NVR (+33%), who jumped from #14 in the 2021 rankings to #4 in the 2022 rankings.
Given the current market conditions and affordability concerns, we would have expected to see more stability (or even growth) from homebuilders focusing on entry-level product. Interestingly, however, we saw the opposite trend emerge in 2022. The 4 homebuilders that increased new home closings in 2022 are not typically considered entry-level builders and posted average sale prices in the mid- to high-$400’s, whereas builders that are known for offering more affordable housing product such as D.R. Horton, Smith Douglas Homes, and Century Communities experienced double-digit decreases in sales volume. This trend could be attributed to the fact that high home prices and mortgage rates have impacted entry-level buyers the most, which is translating to decreased sales for builders focusing on this product type and price point. Additionally, this trend is being perpetuated by elevated construction costs which are making it increasingly difficult to deliver new housing product below the $400K price point and still reach their desired margins.
Conclusion
We entered 2022 hopeful that the significant momentum built during the post-pandemic homebuying frenzy would carry into the new year, although we did anticipate construction activity and home price growth to return to more sustainable levels throughout the year. In the conclusion of St. Bourke’s 2021: Year in Review report, we predicted that low supply, affordability, and sustained demand would be the driving forces behind Atlanta’s housing market in 2022, and we got it right in many regards: the supply of both new and existing homes hovered near record-low levels due to a slowdown in builder production and lack of incentives for current owners to list their homes, and affordability declined further during 2022 due to a combination of low supply, high land prices, and increased construction costs.
What we did not account for was the impact that inflation, or rather the Federal Reserve Bank’s response to increasing inflation, would have on the general economy and housing market. In an aggressive effort to curb and reduce inflation, the Federal Reserve Bank raised the Federal Funds Rate 7 times during 2022. This combined 425-basis point increase, which represents the largest annual increase to the Fed Funds Rate since the 1980’s, caused mortgage rates to skyrocket. These increased rates., which have had the greatest impact on first-time and first-move up homebuyers, severely decreased the purchasing power of potential buyers and disqualified many would-be buyers from the market.
Fears of a forthcoming recession increased as 2022 progressed, become louder and more pervasive in May and June when inflationary measures showed that the Federal Reserve Bank’s attempts to slow inflation had not yet taken effect. The housing market, which had already begin to cool due to persistent pricing and inventory issues, slowed further furing this period as developers and homebuilders prepared for the worse.
Fortunately for the national economy, the Federal Reserve Bank’s efforts to curb inflation finally took hold towards the end of the summer, and the inflation rate decreased every month from August - December. And while we are not out of the woods yet, more and more economic indicators, including Q4 GDP growth of +2.9%, are pointing towards a “soft landing” for the U.S. economy in 2023 rather than a steep nose-dive into a recessionary period.
Regarding Atlanta’s housing market specifically, we will face a tricky combination of headwinds (inflation, affordability, lot and home supply) and tailwinds (relative affordability, resilient and diverse local economy, favorable demographics) over the next 12 months. The St. Bourke team continues to support a “glass half-full” mentality in regards to Atlanta’s housing market, and we believe that both homebuilder production and home sales will improve as the year progresses.
We expect the following factors to drive Atlanta’s housing market in 2022:
Mortgage Rates: The 30-year mortgage rate jumped from 3.22% in early January to 5.01% in April before peaking at 7.05% in November. Fortunately, mortgage rates decreased in line with inflation over the final months of 2022, and many economist and financial experts predict that mortgage rates will only decline further during 2023. Given the extreme amount of pent-up demand from Millennials aging into homeownership and Baby Boomers aging into retirement/relocation, we believe that demand will begin to rebound in earnest once interest rates get closer to the long term average of 5.00%. Current projections from institutions such as the Mortgage Bankers Association, Freddie Mac, and the National Association of Realtors are projecting 30-year mortgage rates to stabilize between 5-6% by the end of 2023.
Inventory & Supply: Atlanta’s critically low supply of available homes will present further challenges for homebuyers during 2023. Despite the recent decline in buyer demand, supply levels remain at or near record-low levels for both new and existing homes. Based on improving homebuilder sentiment and signals indicating an increase in construction activity, we expect that the supply of new homes will continue to improve over the next 12 months. The supply of existing homes, however, will likely remain well below healthy levels, cementing Atlanta’s supply/demand imbalance for the foreseeable future. Given current home prices and interest rates, there is very little incentive for current homeowners to relocate and list their existing homes as they would likely pay an inflated price for their new home (due to low supply) and be forced to take on a mortgage with a significantly higher interest rate than what they currently have. When you consider that existing home sales account for 80-85% of all homes sales, it becomes evident how such a significant reduction in inventory can impact sales activity and home prices.
Affordability: As mentioned previously in this report, Atlanta’s housing market was officially deemed “unaffordable” during 2022 based on the growing gap between household income and home price. Developers and builders have responded by focusing new home production in areas where land is more readily available (and therefore more affordable) and by introducing different housing product that creates development efficiencies and reduces overall construction costs; however, the imbalance between supply and demand in this market is more prevalent than ever before. While we do expect home price growth to stagnate, or at least moderate, over the coming months based on declining construction materials and labor costs, we do not foresee a considerable decline in home prices for new or existing homes based on the lack of available inventory and persistent imbalance between supply and demand.
2023 will be remembered as a pivot point in the story of the national economy with the first several months of the year providing a solid indication of the path ahead. The St. Bourke team is optimistic that the Federal government’s inflation-fighting measures will continue to produce positive results and that employment impacts will remain relatively limited and isolated within certain sectors of the economy. We have already seen positive indicators of returning demand and rebounding production from our investment and homebuilding clients thus far in 2023, and we feel reasonably confident that the Atlanta housing market will benefit from the significant level of pent-up demand once mortgage rates turn to more palatable levels.
For information about market research & reporting, including custom market reports, please contact Katie Fidler at katief@stbourke.com.
