
Atlanta: 3Q2021
Housing Market Analysis

Atlanta Housing Market Analysis
The Atlanta market continued to rebound from pandemic-lows during 3Q21 despite facing increasing challenges concerning affordability, supply, inflation, and multiple COVID-19 variants.
To-date, the Atlanta market has regained 99.5% of the jobs lost following the onset of the pandemic, adding back +432K jobs since bottoming out in early 2020. The largest gains in recent months have come from the Professional & Business Services, Leisure & Hospitality, and Trade & Transportation sectors (the sectors most impacted when the pandemic hit last year). While the current unemployment rate stands at just 2.5%, it’s important to note that Atlanta’s overall labor force comprises 40K fewer people now than it did in January 2020, an indication that the employment has yet to truly recover to pre-pandemic levels.
Atlanta’s housing market improved during 3Q21 in line with the larger economy, driven in part by the following factors:
The Return of Seasonality: Historically, the beginning of the school year signals the end of the busiest home buying season. 2020 was certainly the exception to this; home construction and sales ramped up last fall as builders raced to take advantage of the pent-up demand coming off a stifled summer selling season. Over the last three months, however, we’ve witnessed a shift that indicates the return of normal seasonality: quarterly housing starts, lot deliveries, and new home closings all dipped from 2Q21 to 3Q21 (although still recorded YoY increases).
Sustained Demand: While the pandemic certainly resulted in high levels of pent-up demand, it has not been the only factor driving demand in this market. Demographic tailwinds, most notably the aging up of Millennials into prime home-buying years, has also contributed to unprecedented levels of demand. The Millennial homeownership rate has increased nearly 10% in the last 3 years, and 30% of non-homeowning Millennials plan to begin shopping for their first home in the next 2-3 years. In addition to these demographic shifts, increasing interest rates and the looming knowledge of rate hikes in 2022 and 2023 has created a “FOMO” situation for many potential homebuyers, pushing them to buy their new home and lock in a low rate before the opportunity is gone.
Low Lot & Home Supply: As has been the case for more than a year now, low lot and home supply have created a hyper competitive housing environment for builders and homebuyers alike. While developers have ramped up lot production efforts, the majority of new lots are spoken for by homebuilders before dirt is turned, and increases in housing starts have essentially negated any gains in terms of supply levels.
Sources: U.S. Bureau of Labor Statistics, Business Insider, Trulia, Zonda/Metrostudy, Federal Reserve Bank
Mortgage Rates
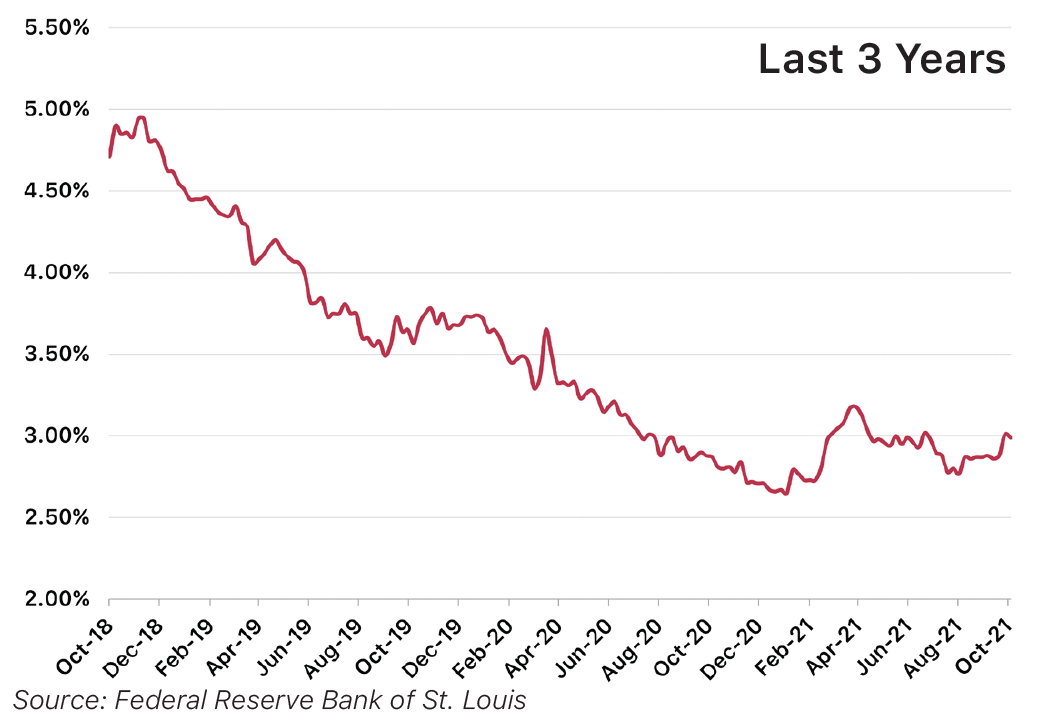
Source: Federal Reserve Bank of St. Louis
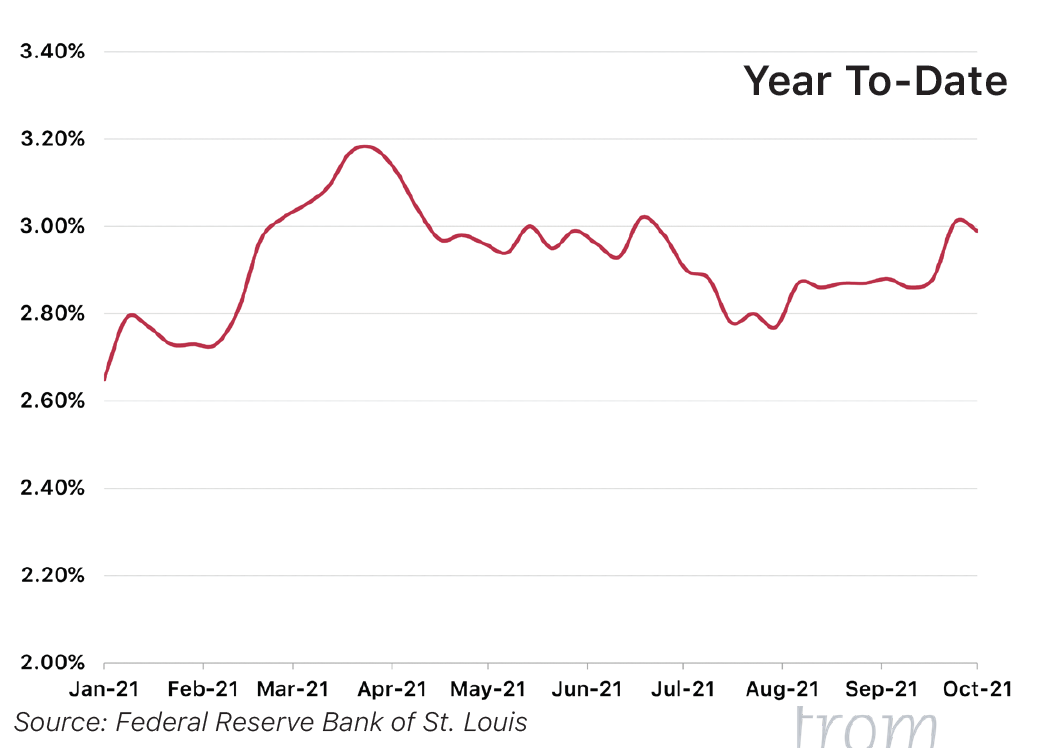
Source: Federal Reserve Bank of St. Louis
While 30-year mortgage rates are still well below the historical average, they crept up steadily during 3Q21 and ended the month of September just above 3.0%. In September, members of the Federal Reserve Bank indicated that they will soon taper off purchases of mortgage-backed loans and could potentially raise rates in 2022, which will likely push interest rates back to pre-pandemic levels (3.5% - 4%) over the next 6-12 months.
Active Listings
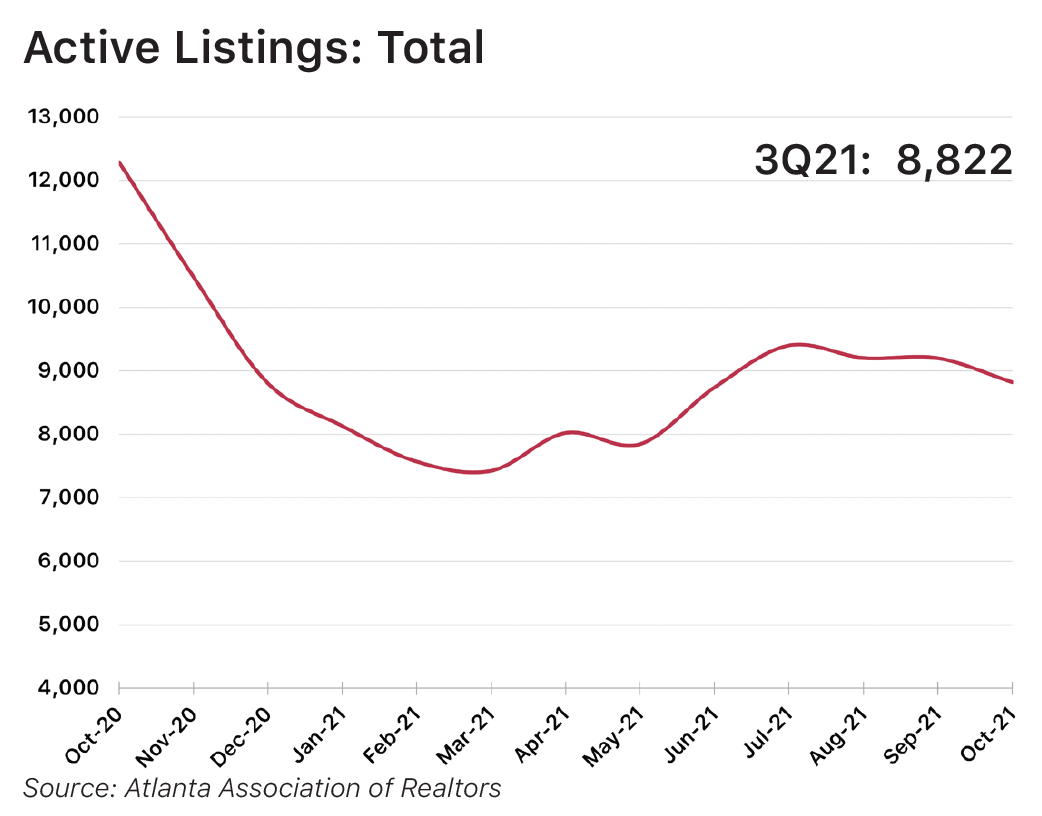
Source: Atlanta Association of Realtors

Source: Atlanta Association of Realtors
Despite rebounding slightly in 2Q21, the number of active listings decreased again during 3Q21 and currently stands at just under 9,000 available homes in the Atlanta market. The consistent decline in inventory, driven by a combination of elevated concerns regarding the Omicron variant of COVID-19 and the return of seasonality to the market, continues to drive home price growth at an accelerated (and unsustainable) rate. As of the end of 3Q21, the Atlanta market has just 1.3 months’ supply of homes available for sale, down from 2.3 months at the end of 2Q21 (normal supply in a healthy market is considered to be 6-8 months).
Housing Starts
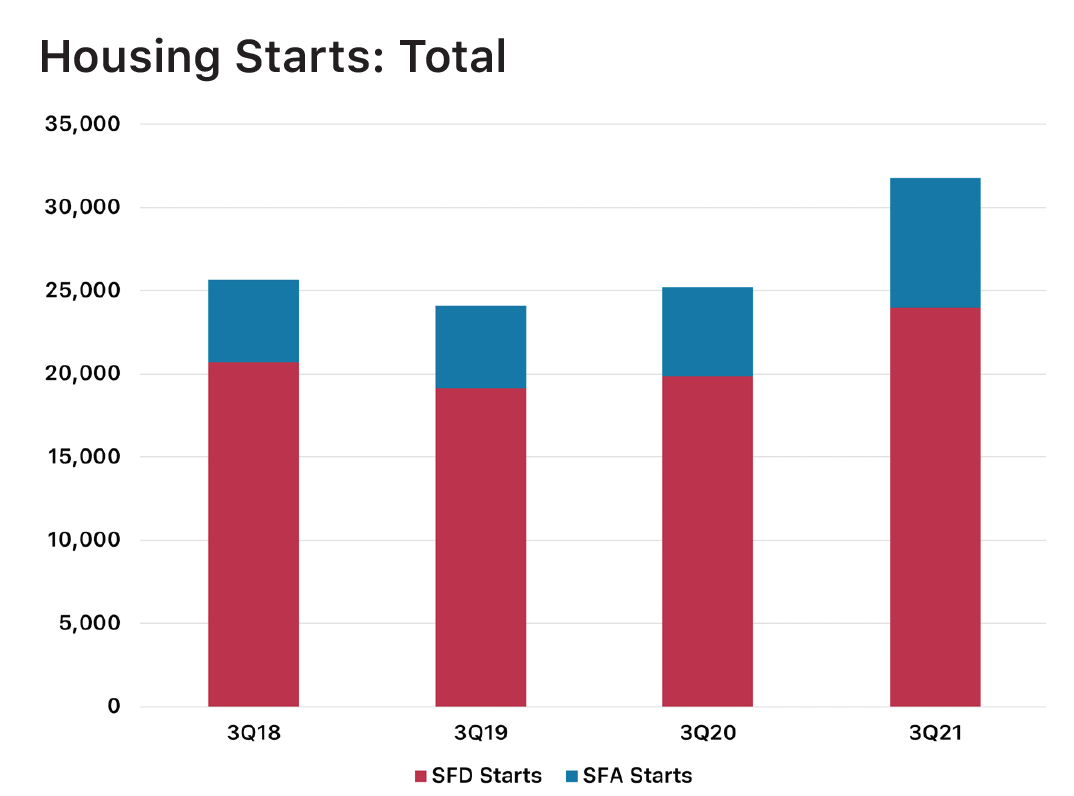
Source: Metrostudy
12 months, eclipsing the 30,000 mark for just the second time since 2007. Single-family detached (SFD) starts grew by nearly +21% over the last 12 months as builders ramped up production to meet the seemingly infinite demand for new homes. Single-family attached (SFA) starts have exploded in recent months, increasing by +45% since the end of 3Q20. SFA product has become more popular for builders in this current environment of increased costs and extended construction times, allowing them to maximize project density and preserve their bottom line.

Source: Metrostudy
Increasing land and materials costs continue to push new home prices higher. As shown in the graph above, there has been a significant shift in new home prices over the last 3 years; in recent years, the level of activty across the $200K-$400k price segments was fairly consistent, but that has shifted dramatically over the last 12 months. Home starts in the sub-$250K price segment decreased by nearly -40% over the last 12 months, as compared to +57% and +99% increases in the $300K-$399K and $400K-$499K segments, respectively.
Home Closings

Source: Metrostudy
Annualized housing starts increased by +13% during 3Q21, reaching the highest level since mid-2008. SFD home closings increased by a solid +9% over this period, evidence of the sustained increase in demand for new housing. SFA closings grew by nearly +30% over the same period, further supporting the notion that both builders and homebuyers are becoming increasingly attracted to attached housing product given the concerns arounding supply and affordability.
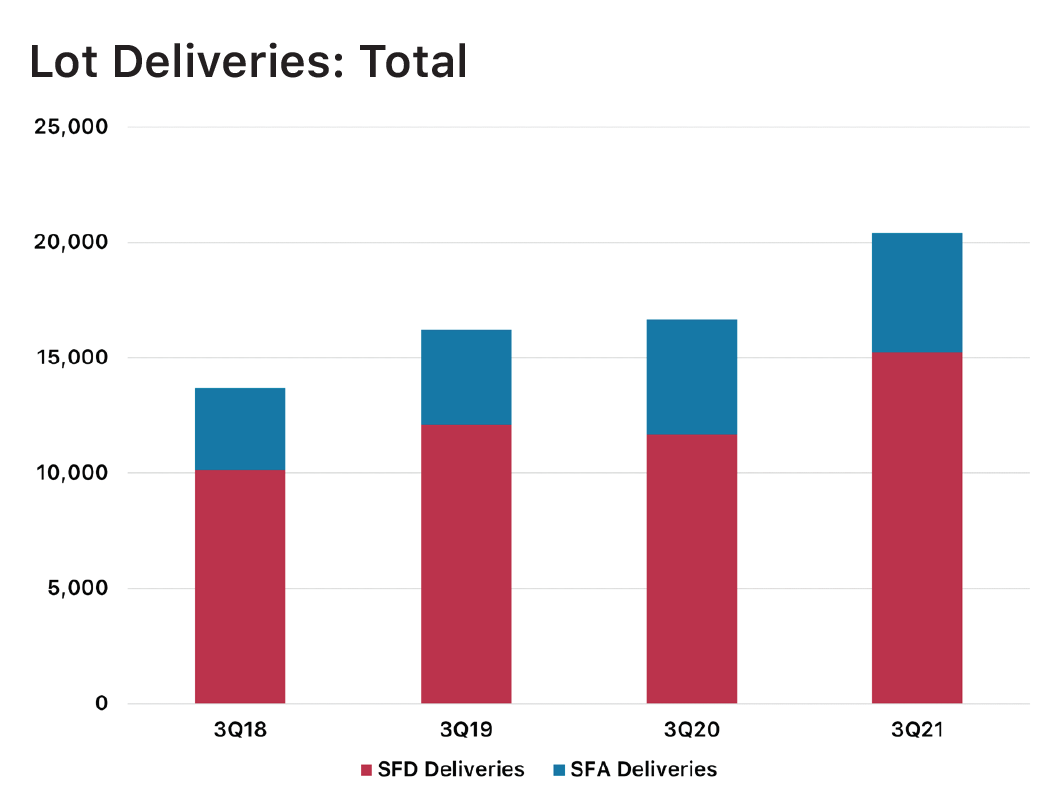
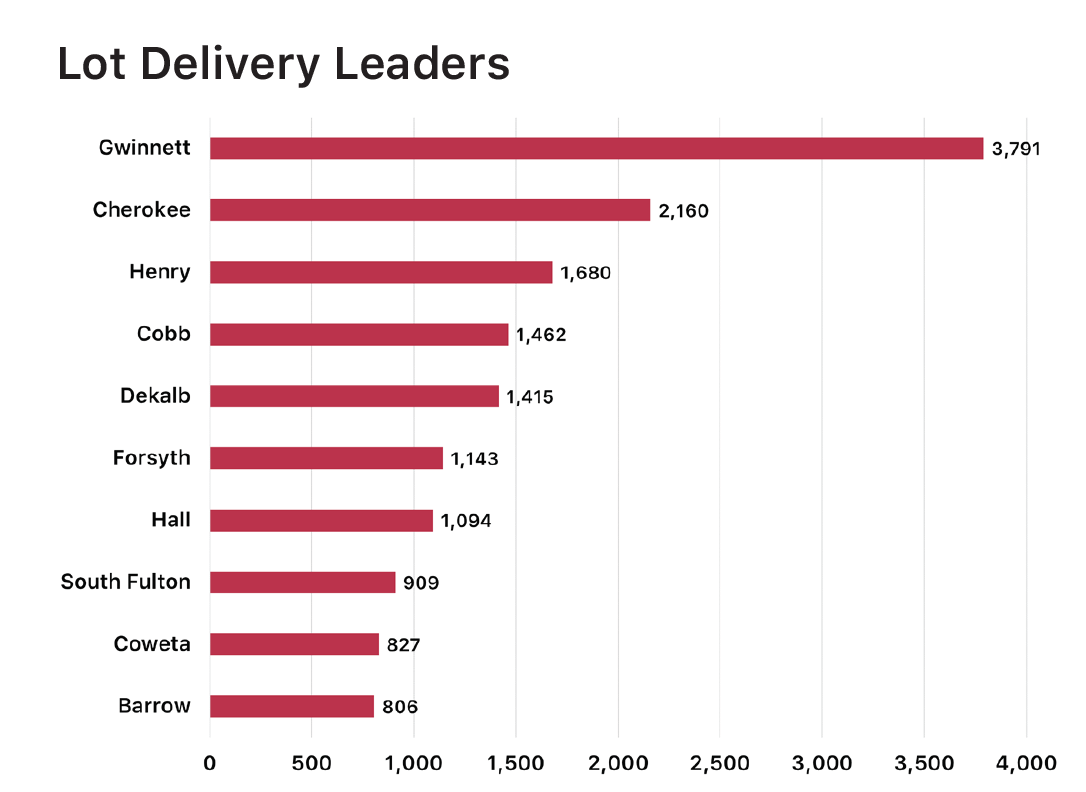
Lot Deliveries

Source: Metrostudy
As discussed previously in regards to housing starts, new home closings have undergone a dramatic shift over the last 12 months as builders increase homes’ base prices in an effort to preserve their diminshing margins. Closings in the sub-$250K price segment decreased by nearly -35%, whereas homes in the $300K-$399K and $400K-$499K price segments increased by +40% and +55%, respectively.
Source: Metrostudy
As shown in the graph above, annual lot deliveries ramped up significantly during 3Q21 as developers & builders scrambled to bring new lots online and take advantage of elevated demand. SFD lot deliveries in the Atlanta market increased by +31% over the last 12 months, eclipsing +15,000 new lots for the first time since 2008. SFA starts increased more modestly (+4%) over the same period and are currently hovering near late-2008 levels.

Source: Metrostudy
Most of Atlanta’s future lots (83%) fall into the Dormant category, meaning that there was been no development or new home construction activity in the last 24 months; it’s estimated that as many as one-third of these Dormant lots will never actually come on-line. There are currently more than 35,000 lots in active development, the majority of which are in the Excavating phase. These 35,000+ lots will likely be delivered in the next 6-12 months.
Inventory & Supply
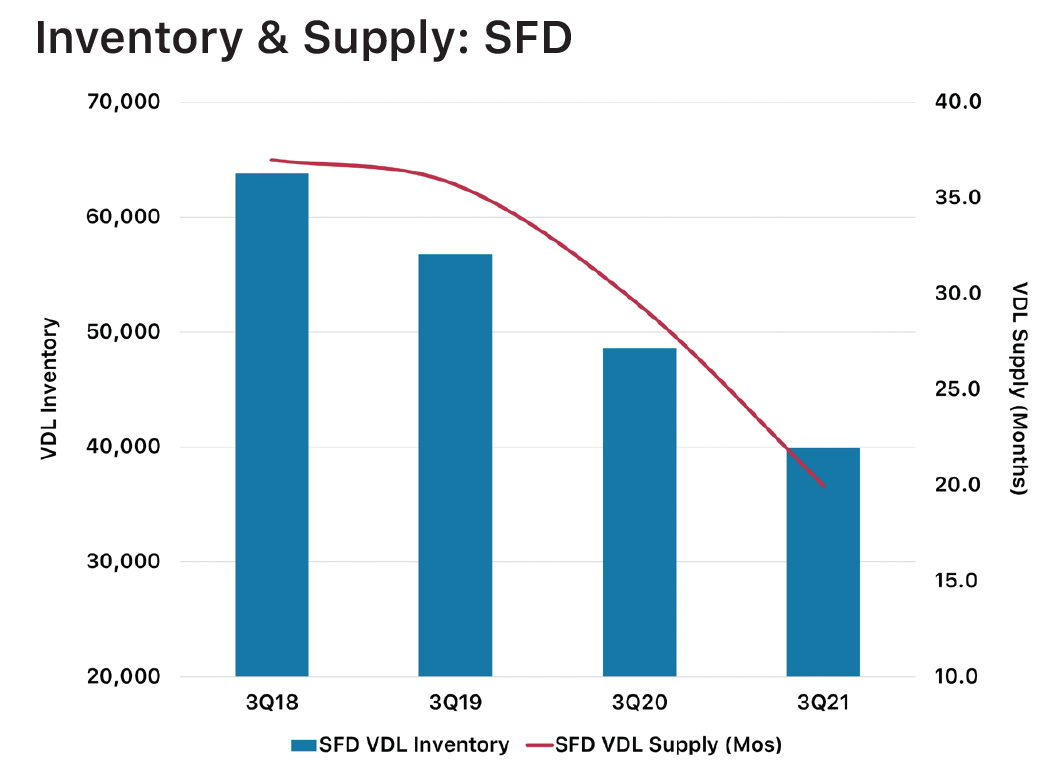
Source: Metrostudy
Both SFD inventory and supply levels continued their downward trajectory in 3Q21. VDL inventory has dropped below 40,000 lots, and supply fell to just 20 months (-18% since 3Q20). Despite the significant increase in lot development in recent months, starts and sales continue to outpace lot deliveries by a wide margin, meaning that supply issues in the Atlanta market won’t disappear any time soon.
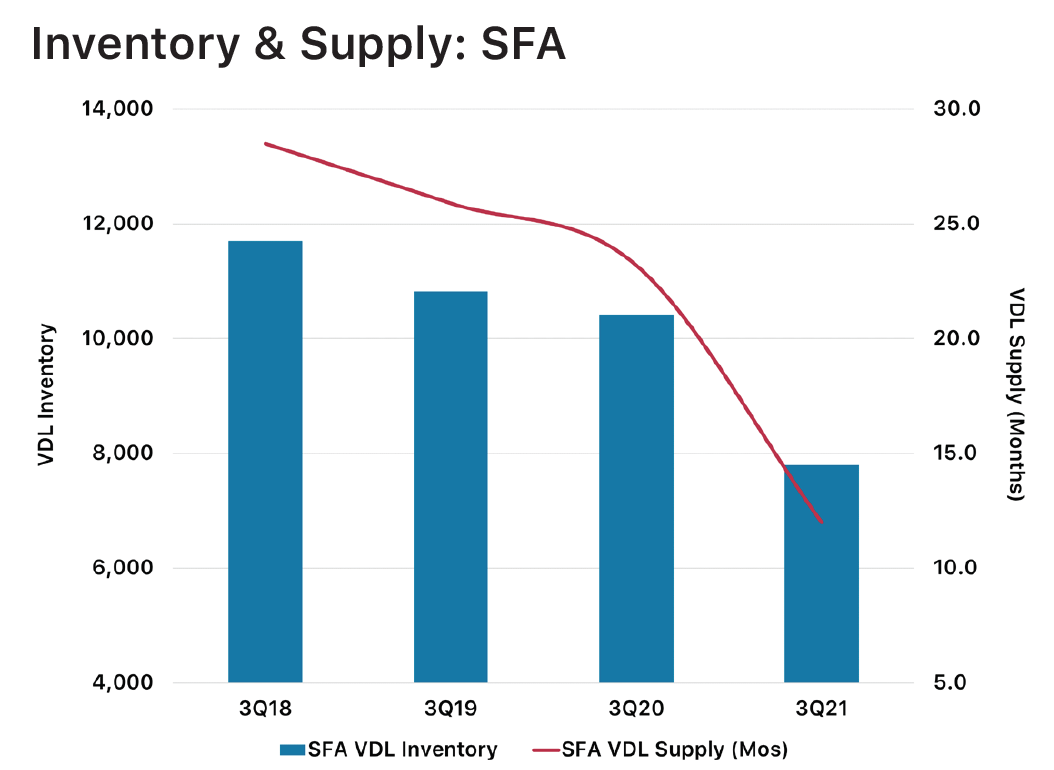
Source: Metrostudy
SFA VDL inventory and supply decreased during 3Q21, dropping -25% and -48%, respectively, over the last 12 months. Increased demand for attached housing combined with a minimal increase in attached lot development has pushed current supply levels to just 12 months, the lowest level since early 2003 when attached home production was essentially a non-factor in the Atlanta market.
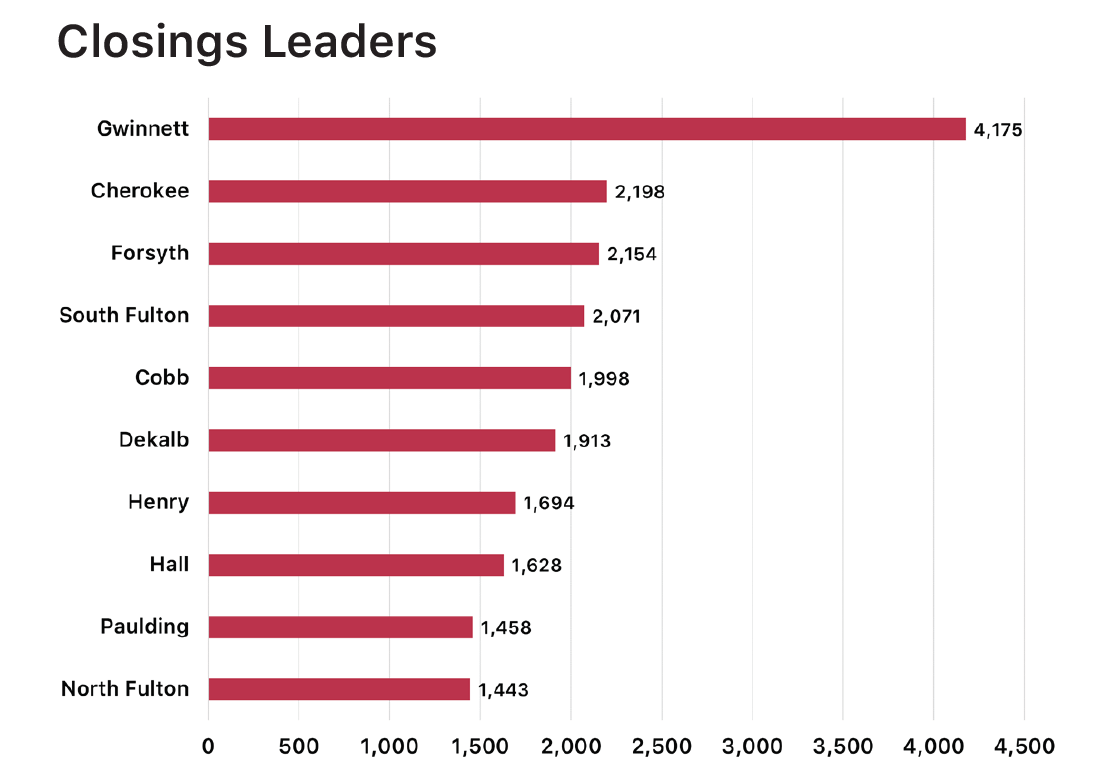
Market Leaders

Source: Metrostudy
Gwinnett County continues to lead the Metro area in housing starts, followed by South Fulton, Cherokee, Forsyth, and Dekalb counties. South Fulton, Cherokee, and Forsyth are relative newcomers to the top rankings, and have exploded over the last 12-24 months because they still have what some other counties do not - lots. 19 of Metro Atlanta’s 24 counties experienced a double digit percentage increase in housing starts over the last 12 months, led by Bartow (+71%), Fayette (+51%), and Spalding (+55%) counties.
Source: Metrostudy
No surprise here, but Gwinnett County leads the Atlanta market in new home closings as well with Cherokee, Forsyth, South Fulton, and Cobb counties rounding out the top 5. With the exception of Gwinnett and Cobb counties, which have long been the darlings of new home construction in Atlanta, we are seeing a surge of new home construction and closings in counties that have historically been overlooked by builders and land developers. As VDL inventory in “in-town” submarkets continues to plummet, these “secondary” submarkets will draw more and more attention from builders and perspective homebuyers.
Source: Metrostudy
As with Starts and Closings, Gwinnett County led the Atlanta market in annualized lot deliveries in 3Q21, increasing lot production by +8% over the last 12 months. The real story here is Cherokee and Henry counties, however, which increased lot production by +96% and +84%, respectively, since the end of 3Q20. 15 of Metro Atlanta’s 23 counties experienced a double digit percentage increase in lot production over the last 12 months, with counties farthest from the city center experiencing the most growth; this is evidence that builders are scrambling to put down lots wherever they can and more homebuyers are now willing to consider submarkets once considers too fr from the city center to be viable for mass residential development.

Active Communities
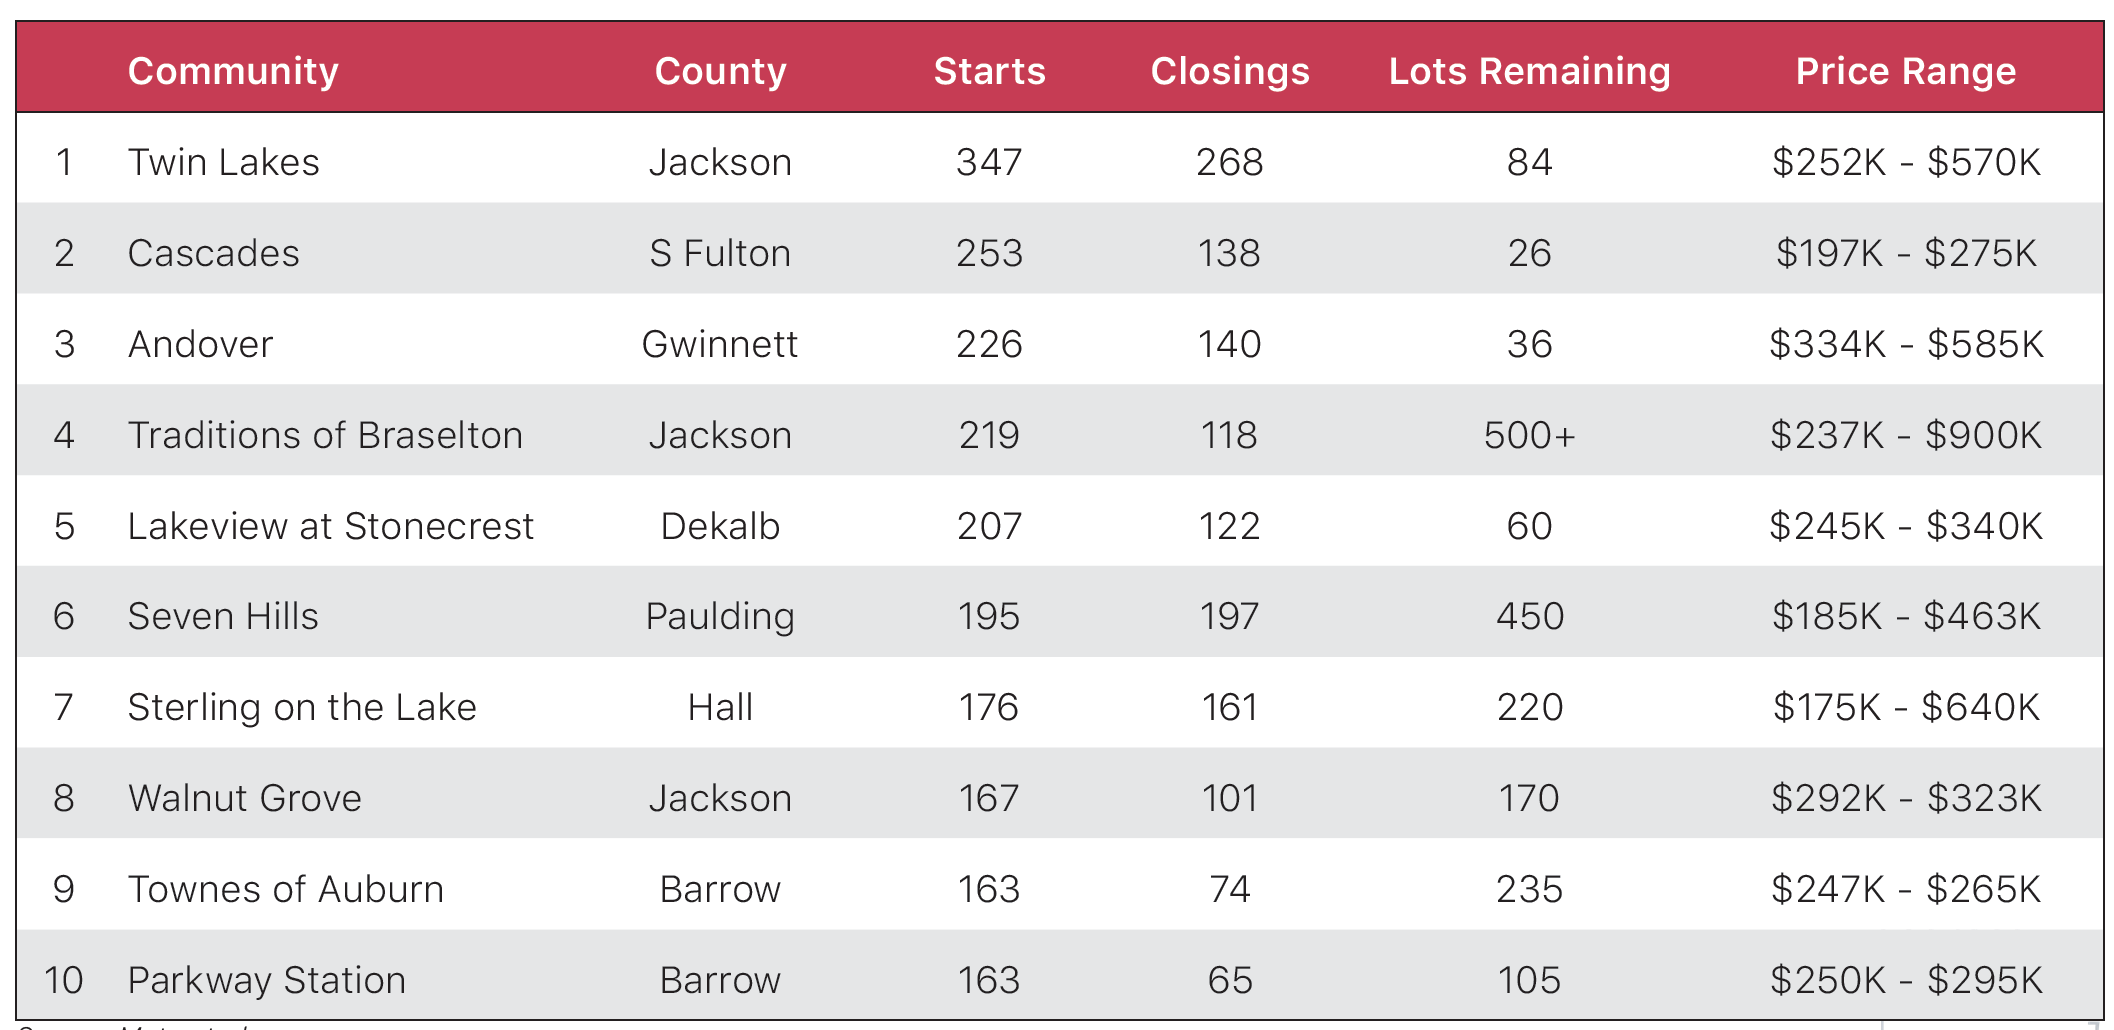
Source: Metrostudy

The map to the right provides a visual summary of the top-performing communites in Atlanta over the last 12 months. After diving deeper into each of these communities, here are a few of our key takeaways:
The majority of these communities (7 of 10) offer a mix of both SFD and SFA housing product.
6 of these 10 communities have less than a one-year supply of lots remaining, and another 2 communities have less than a two-year supply.
Jackson and Barrow counties are emerging as top submarkets for both lot development and new home construction, accounting for nearly half of the top 10 communities. We expect this trend to continue based on extremely limited land supply in “primary” counties like Gwinnett, Cobb, Fulton, and Gwinnett.
Leading Builders

As has been the case since coming out of the Great Recession, DR Horton leads the Metro Area in new home construction and sales, accounting for more new home closings than the #2 and #3 homebuilders combined. The rankings have gone through a notable shifts in recent months with smaller regional builders like Liberty Communities and Rockhaven Homes clawing their way up the Top 10 list and accounting for their largest market shares since entering the Atlanta market.
9 of these 10 top builders increased new home construction over the last 12 months, with 5 of those experiencing double digit percentage growth over that period. Both Liberty Communities and Rockhaven Homes have doubled home production over the last year despite the headwinds of increased land costs and extended home construction times.
Conclusion
Based on our analysis of the housing market and larger economic trends over the last 12-18 months, we have a lot of confidence in the Atlanta market and its future trajectory as 2021 comes to a close. While increases in annualized housing starts, new home sales, and lot deliveries present a light at the end of Atlanta’s low supply/high prices tunnel, there are several factors that should be monitored closely in the coming months as they could potentially have negative or stagnating impacts on the housing market:
Affordability: Declining affordability is not just a national problem; it’s been felt sharply here in the Atlanta market as low inventory and supply levels of both lots and homes have pushed prices higher than ever before. As of the end of 3Q21, home prices were up +16% YoY – an unsustainable rate of growth, especially given that wages in Atlanta have only increased by +3% over that same time period. Resale housing inventory is still a fraction of what it was pre-pandemic, finished lot inventory is critically low and shrinking every month despite increased lot development efforts, and increased building costs and extended construction timelines have suppressed new home production for more than a year now. While we are seeing signs of the market moving back towards equilibrium, we aren’t there yet, and the aforementioned factors will continue to eat away at affordability in the Atlanta market for the foreseeable future.
Inflation & Impending Rate Hikes: Inflation has become an increasing concern for the national economy in recent months as the effects of printing and pumping billions of dollars into the U.S. economy to insulate the American people as much as possible from pandemic-related financial hardships begin to emerge. The average price of consumer goods is up nearly 7% in 2021, far outpacing wage growth over the same period. The Federal Reserve Bank has made public statements addressing this increasing concern, noting that they are planning three rate increases to the Federal Funds Rate in 2022 and two hikes in 2023 to help ease the inflationary ramifications. Additionally, the Federal Reserve Bank as indicated that it will significantly scale back its purchases of Treasuries and mortgage-backed securities with the goal of ending the program completely early in 2022. For a potential homebuyer, this translates to higher mortgage rates and increased monthly costs associated with securing a home loan.
The End of (Some) Federal Support: The end of 2021 will signal the end of two Federal support programs that have been providing considerable relief to the majority of Americans – the Child Tax Credit and the suspension of Federal Student Loan payments, both of which are scheduled to concluded at the end of 2021. For many American families, especially those that fall into key home-buying demographics, this will translate into a swing of $1,000+/month, give or take a few hundred dollars. Millennials, the largest homebuying segment in the market, will unfortunately be most impacted by the conclusion of these programs.
Low Supply Levels: As mentioned in the opening summary of this report, low levels of both lot and home supply have had major implications in the Atlanta housing market. Housing starts and sales have increased in line with lot production, which has translated to further diminished supply in nearly every submarket in Atlanta. Consistently high demand combined with extended lot development and home construction timeframes mean that it is extremely likely that inventory levels remain near record-low levels through the end of 2021 and into next year.
For information about market research & reporting, including custom market reports, please contact Katie Fidler at katief@stbourke.com.
