
Atlanta: 2Q2022
Housing Market Analysis
Atlanta Housing Market Analysis
While the Atlanta region was not immune to the challenges facing the broader U.S. economy during Q2, most economic indicators remain relatively positive. The unemployment rate remains low due to Atlanta’s diverse economy, and major employers continue to announce corporate and workforce expansions. Within the last three months, McKinsey & Co announced a 700+ job expansion to their Midtown office, NBCUniversal announced intentions to develop a 43-acre studio campus as part of The Assembly master-planned project in Doraville, and Google is moving forward with a 500K sqft office expansion that will allow them to add 1,500 more employees to their Atlanta office.
Atlanta’s housing market contracted during Q2 due to a combination of both micro- and macroeconomic factors. On a microeconomic scale, 18+ months of unsustainable price growth has made a sizeable dent in the number of Atlanta households who can afford to purchase a home in the current conditions. On a macroeconomic level, high inflation, rising interest rates, and threats of a recession have deflated consumer confidence and worked to diminish (or at least delay) demand for housing. Two major factors that drove Atlanta’s housing market in Q2 include:
Declining Affordability: The Atlanta market was officially deemed “unaffordable” by the Atlanta Federal Reserve Bank during Q1, and home prices showed few signs relief during Q2. According to the Atlanta REALTORS Association, the median home sale price ($435K) increased by +10.1% from Q1 and is up +16.8% from 2Q21. While price growth is clearly slowing, prices continue to increase on a monthly basis. For context, households earning the median income level for the market (approximately $72,000) can only reasonably afford homes priced at or below $300K, which is why a median home price in the $400’s and interest rate increases equivalent to a $25K+ bump to the base price of homes are a growing concern.
Low Inventory: As has been the case for the last 24 months, Atlanta’s inventory of both finished lots and available homes remains well below normal market levels. Builders quickly snatched up all of the most desirable VDLs once it was clear that demand for housing survived the initial downturn, which pushed the VDL supply to critically low levels. This lack of VDLs has been made worse by extended future lot development times, which have slowed due to skilled labor shortages and municipal slowdowns. Meanwhile, record low interest rates and the WFH movement drove demand sky high and desperate buyers snatched up houses, seemingly regardless of location or condition, as quickly as possible in an attempt to lock in record low interest rates and move away from crowded living situations. This sudden upswing in demand depleted Atlanta’s stock of available homes over the course of just a few month.
Sources: Atlanta REALTORS Association, Federal Reserve Bank of St. Louis, Bureau of Labor Statistics. U.S. Census Bureau, Metrostudy/Zonda
Mortgage Rates
Source: Mortgage Bankers Association
Source: Mortgage Bankers Association
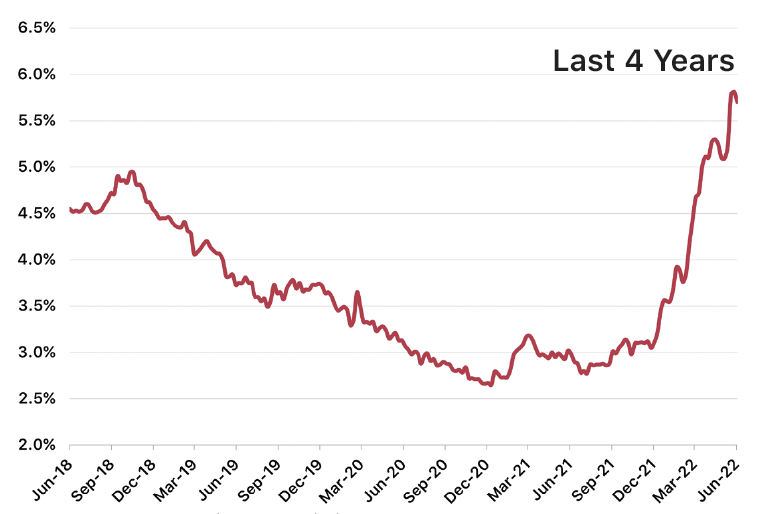
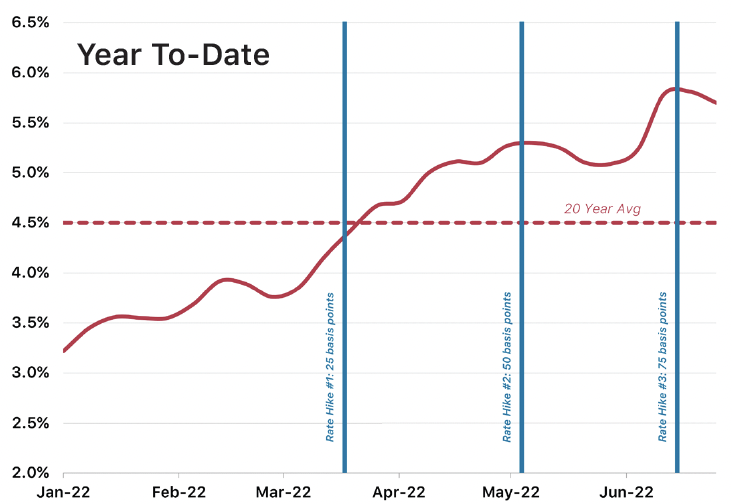
The 30-year mortgage rate climbed rapidly to 5.7% in Q2 due largely to the Federal Reserve’s three increases to the Fed Funds Rate in the first half of the year. The Federal Reserve raised the Fed Funds Rate an additional 75 basis point during their late July session, and additional rate increases totaling up to 100 basis points are expected before the end of the 2022. As such, 30-year mortgage rates are expected to climb further over the coming months, likely bouncing between 6% and 7% for the remainder of the year.
Active Listings
Active Listings: Total

Source: Atlanta Association of Realtors
Active Listings: Month’s Supply

Source: Atlanta Association of Realtors
High home prices and interest rates stifled demand in Q2, which had a positive impact on the inventory and supply of available homes in the Atlanta market. Active listings improved by +63.7% during Q2 and reached their highest level since November 2020. Supply improved significantly as well, increasing from 1.0 month in Q1 to 1.6 months in Q2. We expect inventory and supply to improve further in 2022 as sellers and buyers alike react to the current market uncertainty.
Housing Starts
Housing Starts: Total

Source: Metrostudy
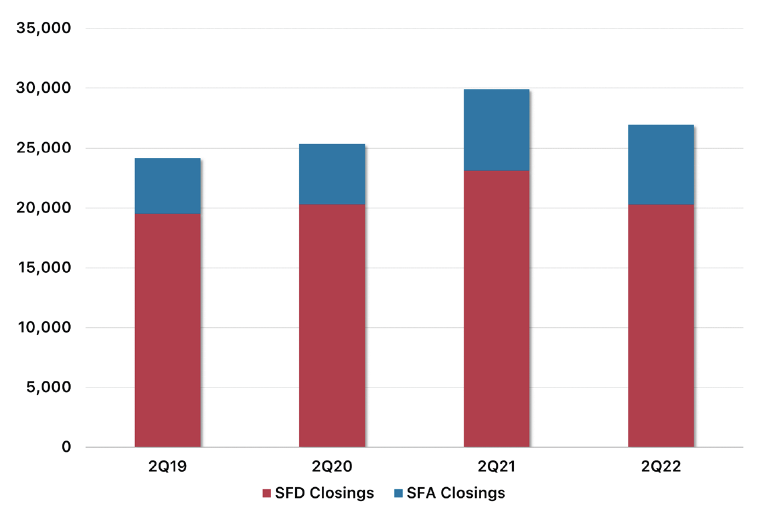
Total starts activity fell during Q2 as builders reacted to waning demand and high construction costs. Detached and attached housing starts declined by -9.1% and -7.3%, respectively, during Q2 and are down -19.6% and -5.3% from 12 months ago. Builders have increasingly turned toward attached product as a way to maximize project density and offer homes at price points attainable to a larger percentage of the population. Rising interest rates, high housing costs propped up by a critically low inventory of available homes, and continued labor and supply chain issues will likely lead to a continued pullback from builders through the end of the year.
Housing Starts: By Price Range

Source: Metrostudy
The number of housing starts fell for all price segments below $400K during Q2. Over the last 12 months, starts of homes below $250K have declined by -73.5%, homes below $300K by -61.1%, and homes below $400K by -40.4%. Housing starts for homes above $400K grew significantly over the same period, however; the number of starts for homes above $400K and $500K have increased by +46.3% and +57.8%, respectively, over the last 12 months. A cooling market could see a slight shift back towards the lower price tiers as the year progresses, but prices are likely to remain high (unattainable for households making less than $100k annually) given high land and construction costs.
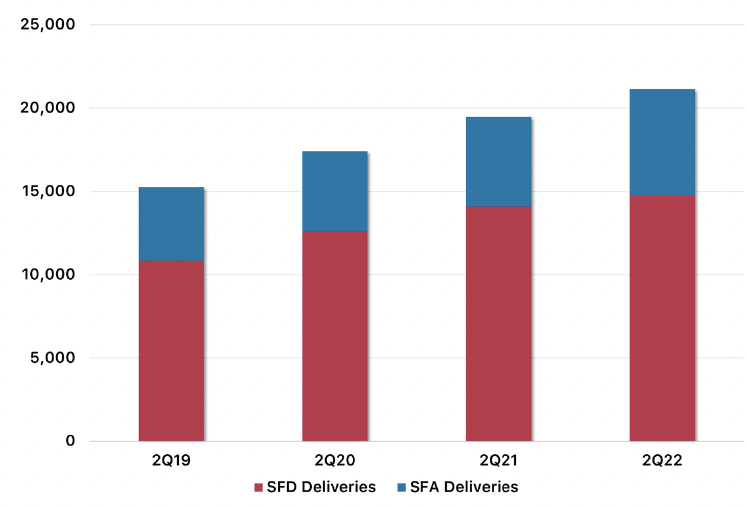
New Home Closings
New Homes Closings:
Total
Source: Metrostudy
As with starts, new home closings declined on both a quarterly and annual basis during Q2. Detached closings are down -4.5% from Q1 and -12.2% from 2Q21, and attached closings are down -4.3% and -9.9% over the same periods. The decline in new home closings is less about diminishing demand for housing and more about Atlanta’s skyrocketing home prices; with a median home price of $435K (across both new & existing home sales) and a median household income of just under $75K, 65-70% of Atlanta households have effectively been priced out of the housing market.
Lot Deliveries
New Homes Closings:
By Price Range

Source: Metrostudy
The $300-399K range continues to be the dominant price segment in the Atlanta market, however we have seen a drastic shift to the higher price tiers over the last 12 months. In years past, the $200-$249K and $250-$299K price segments filled out the top three behind the $300-399K segment, but they were replaced by the $400-499K and $500K+ segments in Q2. The number of new home closings below $300K has fallen -49.1% since 2Q21, compared to +54.4% and +51.9% increases in new home closings above $400K and $500K, respectively.
Lot Deliveries: Total
Source: Metrostudy
Total lot deliveries decreased slightly from Q1 (-2.5%) but are up +8.5% since 2Q21. Detached lot deliveries declined by -7.3% from Q1 but increased by +4.5% from 12 months prior. Attached lot deliveries, however, diverged from this pattern and posted quarterly and annual increases of +10.7% and +19.2%, respectively, in Q2. Lot development will likely contract further as the year progresses due to declining demand from uneasy builders.
Lots in Development
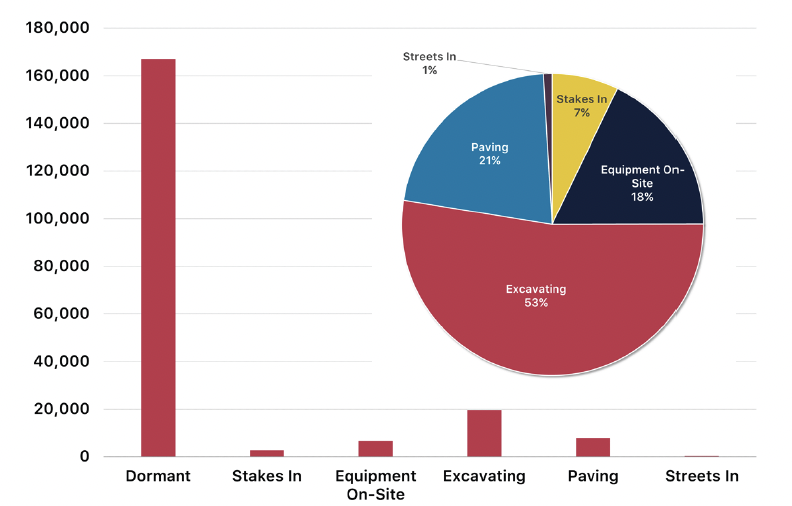
Source: Metrostudy
As of Q2, there were approximately 37,400 lots in active development across the Metro area. This represents a slight decrease from Q1 (-0.8%) but a +4.1% increase over the last 12 months. The MSA’s critically low inventory of finished lots justifies a significant uptick in development to better match demand, however high development costs, extended delivery times, and general housing uncertainty will likely cap lot development through the end of the year. .
Inventory & Supply
Inventory & Supply: SFD
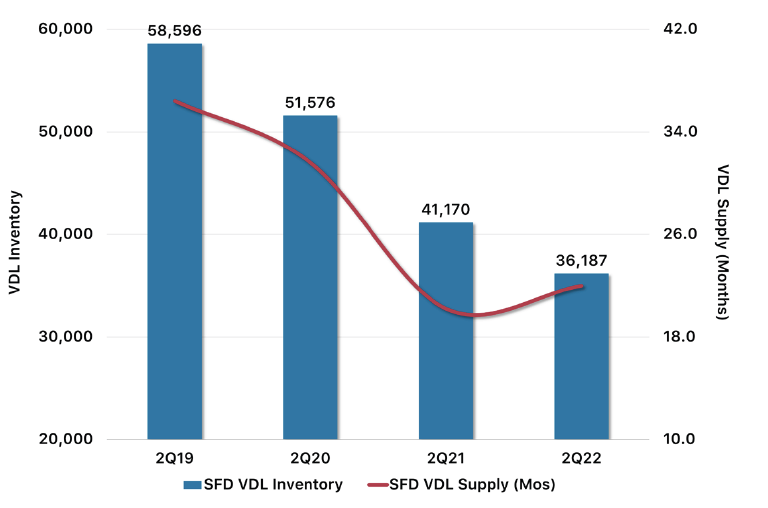
Source: Metrostudy
Detached VDL inventory continued to fall during Q2, however an off-setting decline in starts actually worked to improve the supply of detached lots. Detached lot inventory is down -5.6% from Q1 and -12.1% from 2Q21 while detached supply increased by +3.8% and +8.9% over the same period. While detached VDL inventory will likely continue to fall modestly through the end of the year, we expect home sales to remain well below 2020-2021 levels and supply levels to recalibrate to more normal levels.
Inventory & Supply: SFA
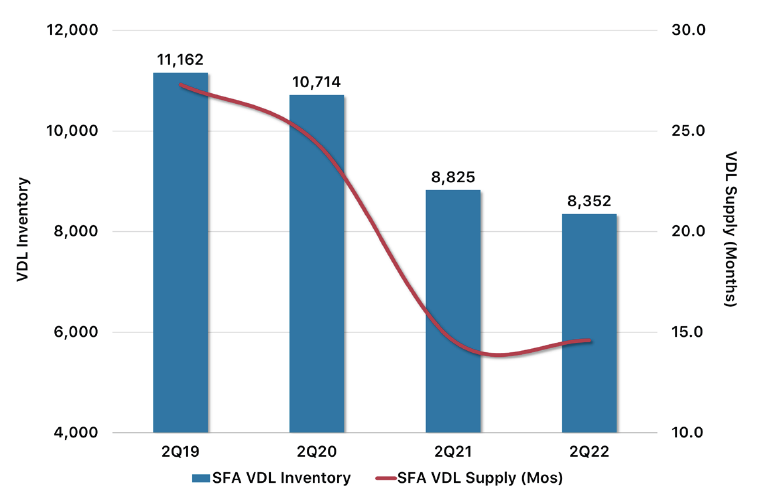
Source: Metrostudy
Attached VDL inventory and supply remained largely unchanged on both a quarterly and annual basis due to an uptick in lot deliveries and consistent starts activity from builders. Inventory improved slightly from Q1 (+1.7%) and ended Q2 just -5.3% below 2Q21 levels. The supply of attached VDLs increased by +9.8% from Q1 and remains unchanged from 2Q21’s level of 14.6 months. We expect demand for SFA lots and homes to remain strong through the end of the year as builders aim to maximize project density and provide more affordable housing options.
Market Leaders
Starts Leaders
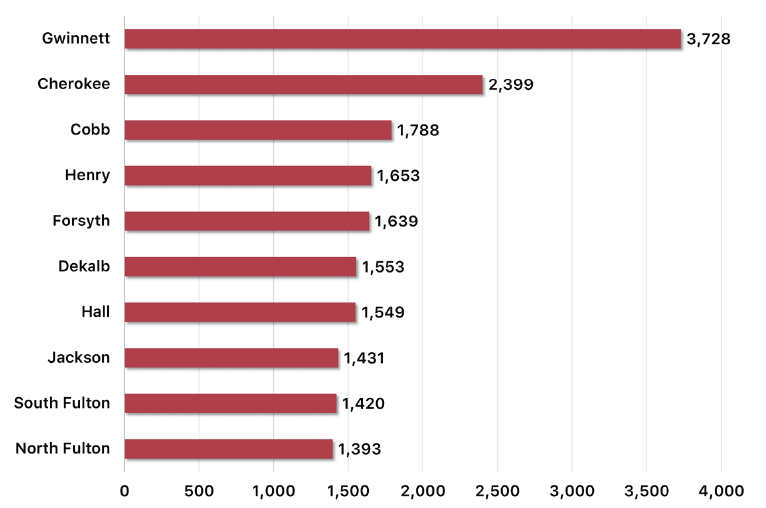
Source: Metrostudy
Despite an -11.4% decline in housing starts over the last 12 months, Gwinnett County continues to lead the Atlanta MSA in housing starts (3,728 annualized starts). Cherokee, Cobb, Henry, and Forsyth round out the top five, combining for 7,479 annualized starts over the last 12 months. Of the 23 counties analyzed, 16 counties (69.6%) have experienced year-over-year declines in housing starts as builders reign in lot development in light of the general economic uncertainty.
Lot Delivery Leaders
Closings Leaders
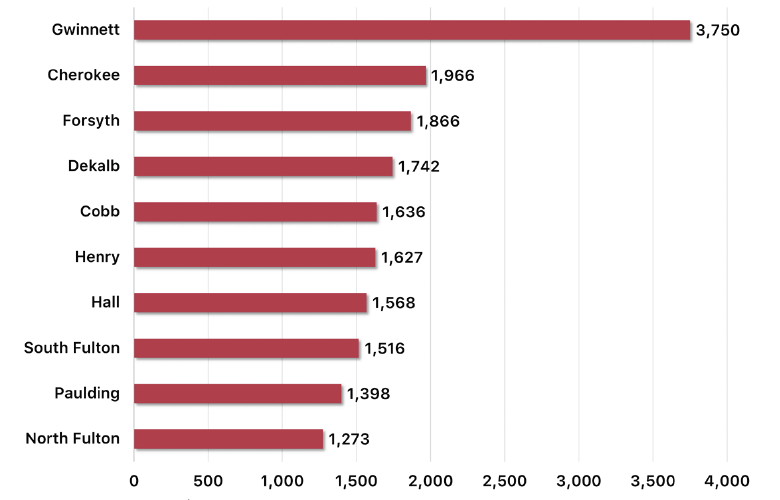
Source: Metrostudy
As has been the case for more than a decade, Gwinnett leads the metro area in new home closings (3,750 annualized closings). Similar to its starts activity, Gwinnett closings declined on an annual basis but not enough to unseat them from the top of the list. The top five also included Cherokee (1,966), Forsyth (1,866), DeKalb (1,742), and Cobb (1,636). 15 of the 23 counties analyzed (65.2%) experienced declines in new home closings over the last 12 months.

Source: Metrostudy
13 of the 23 counties analyzed (56.5%) increased lot production over the last 12 months in an effort to bring inventory and supply to more normal levels; 9 of these 13 increased lot production by double digit percentages. Gwinnett County, which leads the MSA in lot deliveries, increased lot production by nearly 1,000 lots over the last year (+26.2%). More than half of the counties comprising the top ten list are located outside of the urban core, evidence that lot development is being heavily influenced by the availability and price of land rather than traditional factors like distance from major employment centers, walkabilility, and the strength of the public schools.

Walnut Grove in Jackson County (Image Credit - D.R. Horton)

Townes of Auburn in Barrow County (Image Credit - Rocklyn Homes)
Most Active Communities
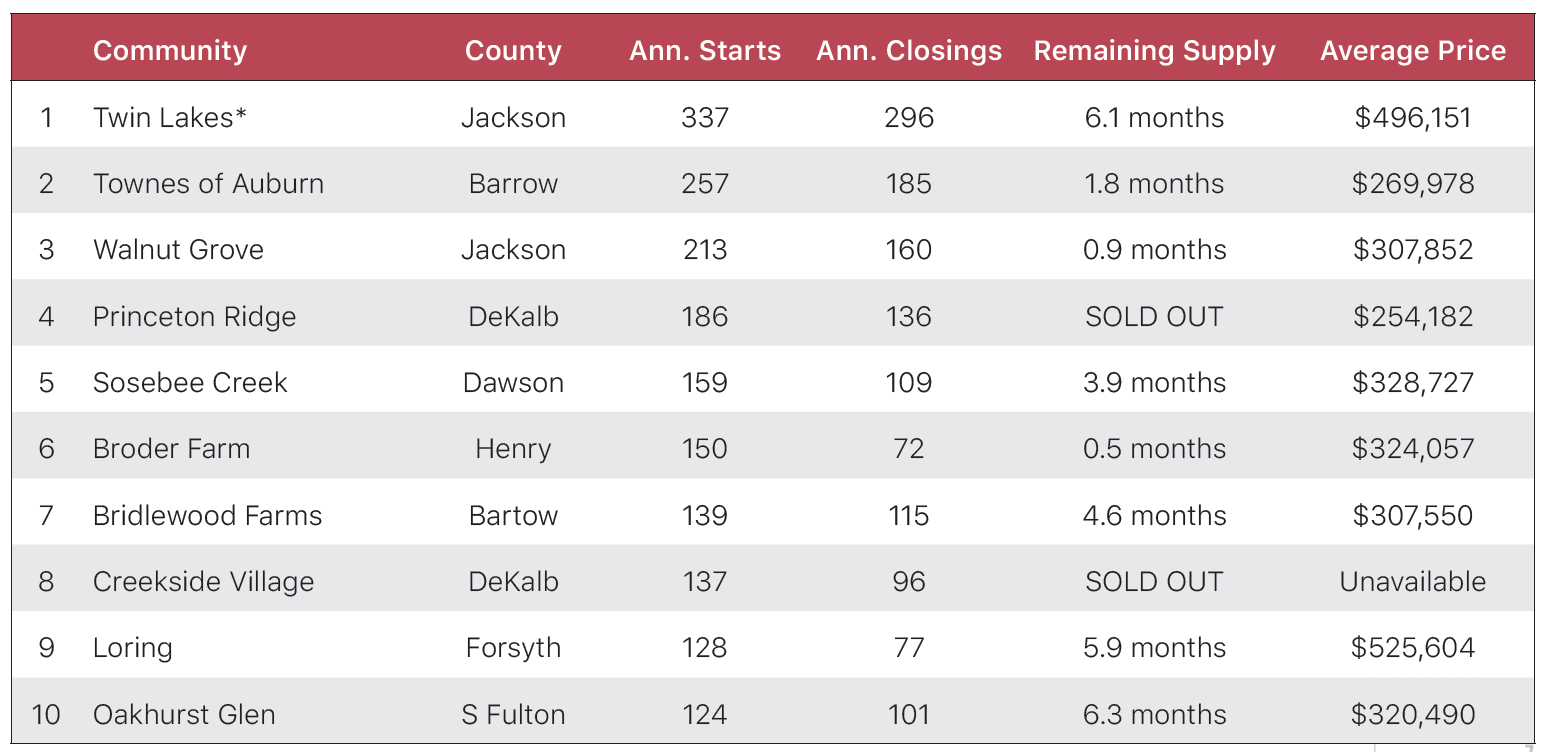
Source: Metrostudy/Zonda
Development activity and home construction continues to be heavily influenced by the availability (and therefore price) of land. With many of the region’s historically dominant counties like Fulton, Cobb, and Gwinnett running out of land suitable for residential development, builders are pushing farther from the urban core just to find land tracts where they can make the numbers work.
All 10 of the top-performing communities have less than a year’s supply of finished lots (4 of the 10 have less than 1 month of supply).
6 of the top 10 communities are located more than 30 miles from the urban core.
Only 5 of the top 10 communities have future lots in the pipeline, and only 2 of those 5 have more than a year’s supply of future lots.
Leading Builders
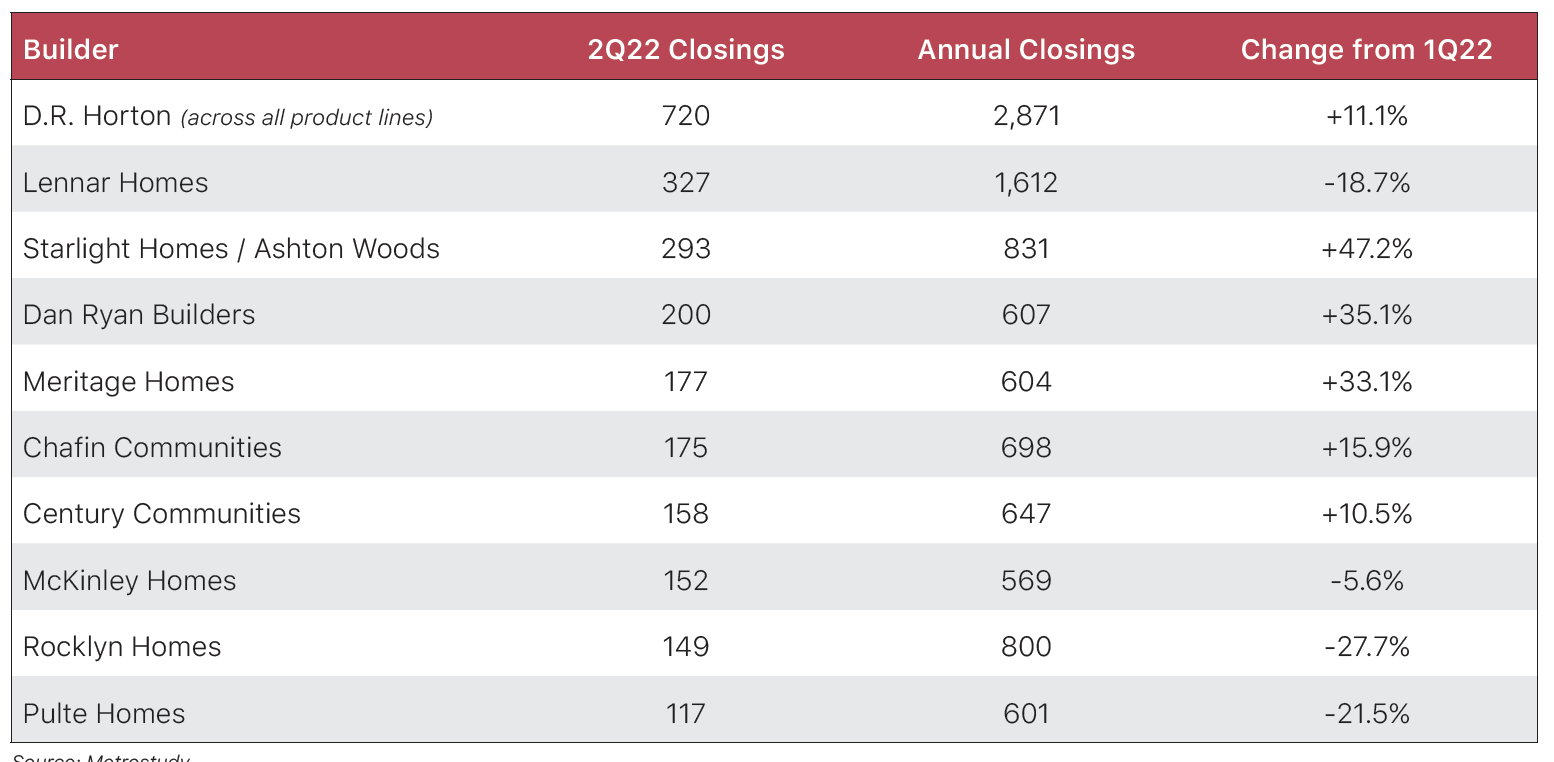
Source: Metrostudy
The changes in builder activity during Q2 was certainly interesting; builders either experienced a sharp increase in closings or a significant decrease in closings with only builder staying somewhat consistent with their Q1 level. D.R. Horton continues to dominate the Atlanta MSA in both starts and new home sales, combining for 720 closings across all their product lines in Q2 (an +11.1% increase from Q1). Other builders with notable upticks in closings include Starlight Homes/Ashton Woods (+47.2%), Dan Ryan Builders (+35.1%), and Meritage Homes (+33.1%). Nearly half of these builders went in the opposite direction, however; Lennar, Rocklyn Homes, and Pulte Homes all posted double digit percentages decreases from Q1. While we can expect all builders to move cautiously over the coming months, both in terms of lot development and housing starts, it’s reasonable to assume that larger regional and national homebuilders will fare a bit better in light of the general uncertainty confronting the housing market at this time.
Conclusion
We knew it was coming.
We knew when the housing market exploded during the summer of 2020 that it could not last forever. When the housing market stayed hot through 2021, setting pricing, construction, and supply level records along the way, we knew that it could not last forever. We knew that real estate was cyclical and that eventually the market would recalibrate and return to more normal levels.
That day has come.
While it’s easy to get caught up in headlines spouting warnings of a housing bubble and evoking memories of the 2008 housing market crash, we need to remember a few key points:
The market desperately needs this. We are witnessing the market stabilize in real time, and while the unknowns of the situation can be scary, factors like accelerating home price growth and ever-shrinking inventories were actually doing more harm in the medium and long-term than good.
Comparing our current situation to 2008 is an unfair, apple-to-oranges comparison, with really the only similarily being that demand for homes was high in both situation. While the main causes for the 2008 crash were sub-prime loans and builder overexplosure, the issues we are facing now revolve around affordability brought on by a supply/demand imbalance. Lender requirements for mortgages remain robust since the passage of the Dodd-Frank Act, and builders have exercised extreme caution in regards to their lot inventory and housing production since coming out of the Great Recession more than a decade ago.
The Atlanta market has several factors that should help to insulate it from some of the broader economic instability. Strong population growth and the high concentration of Millennials will keep housing demand from bottoming out. The concentration of major employers and well-paying jobs will help to stabilize the employment rate despite threats of a potential recession. Despite the rapid uptick in prices over the last 12-18 months, Atlanta remains one of the more affordable Metros, especially when compared to other major cities like Los Angeles, NYC, San Francisco, Chicago, Denver, and Miami.
Based on the Atlanta market’s trajectory over the last 6 months and our analysis of the macroeconomic components contributing to the current economic situation, we believe that the following factors will underpin Atlanta’s housing market through the end of the year:
Pullback in Demand: High home prices and rising interest rates will continue to stifle demand from potential homebuyers through the end of 2022. It’s important to note, however, that this pullback in demand is less a reflection of fewer people wanting to buy homes and more about people wanting to purchase a home but being unable to afford one in the current conditions. Regardless of the underlying cause, the retraction in demand will work to slow home price growth and improve the inventories of both new and existing homes through the end of 2022.
Pricing & Interest Rates: As noted above, we expect that constrained demand will work to slow the unprecedented rate of home price growth that the Atlanta market has experienced over the last 18 months. That being said, we don’t anticipate much of a retraction in current price levels based on the fact the demand will remain relatively strong because of the demographic makeup of this market and housing inventory will likely remain below “normal” market levels, especially considering the recent decline of new home starts by builders and high interest rates deterring current owners from moving and listing their current homes for sale.
Broader Economic Factors: The Atlanta market will undoubtedly continue to feel the impacts of the challenges facing the broader national economy as the year progresses. High inflation has meant less disposable income for households to spend on housing and contribute towards the savings required to make a down payment. 30-year mortgage rates will likely land between 6-7% by the end of the year, adding tens of thousands of dollars to already high home prices. Additionally, declining consumer confidence could stifle consumer spending, further impacting the economy’s growth in Q3 and Q4.
For information about market research & reporting, including custom market reports, please contact Katie Fidler at katief@stbourke.com.
